- Why GBP Analytics Are Non-Negotiable for Local Businesses
- The Core GBP Metrics You Should Be Monitoring Monthly
- Search Queries That Triggered Your Listing
- Profile Views and Impressions
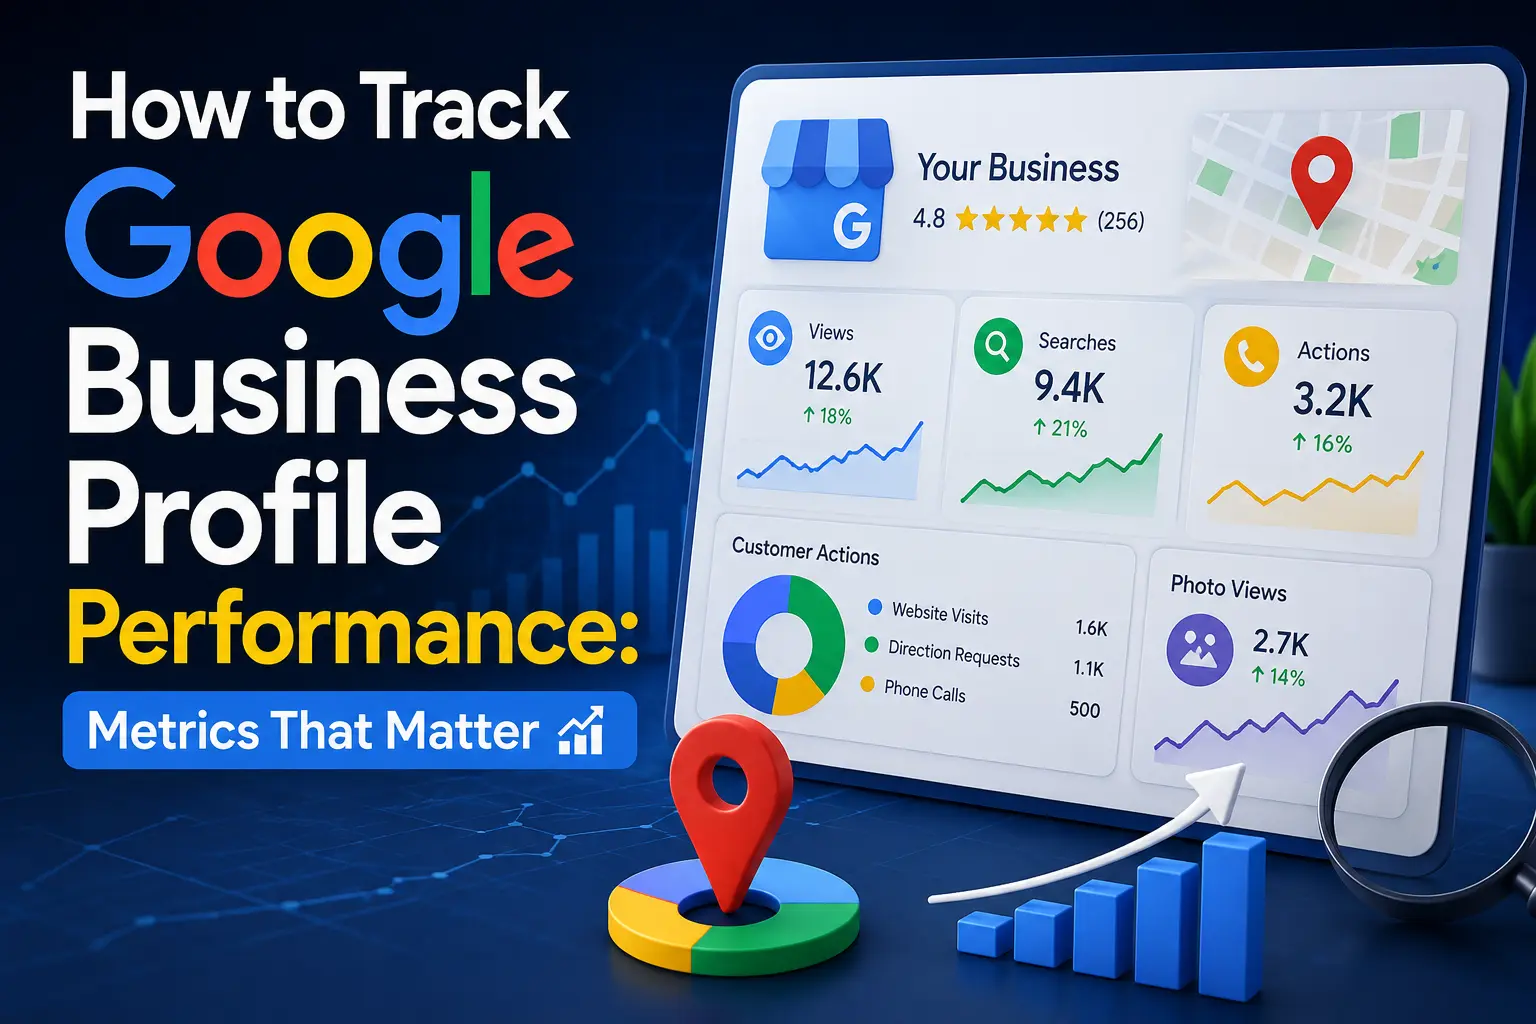
- Customer Actions: The Metrics Closest to Revenue
- Photo Views and Quantity Benchmarks
- How GMB Guru Tracks GBP Performance for Our Clients
- Our Monthly GBP Analytics Process
- Layering GBP Data with Google Search Console
- Review Metrics: The Social Proof Layer of GBP Analytics
- What "Good" GBP Performance Actually Looks Like
- Common GBP Tracking Mistakes That Distort Your Data
- Your Monthly GBP Performance Tracking Checklist
- Ready to Stop Guessing and Start Growing?
How to Track Google Business Profile Performance: Metrics That Matter
 Most US business owners set up their Google Business Profile, verify it, and then… forget it exists. They assume that simply being listed on Google is enough. It isn't. Without actively tracking your GBP analytics, you have no idea whether your profile is generating real foot traffic, phone calls, and website visits — or quietly underperforming while competitors steal your customers. The good news? Google Business Insights gives you a surprisingly rich window into how searchers are finding and interacting with your listing. The challenge is knowing which numbers actually matter, how to interpret them, and what to do when the data tells you something is broken. That's exactly what this guide covers — and it's exactly where our team at GMB Guru delivers measurable value for local businesses every single month.
Why GBP Analytics Are Non-Negotiable for Local Businesses
Your Google Business Profile is often the very first touchpoint a potential customer has with your business — before your website, before a Yelp page, before anything else. According to Google's own data, businesses with complete and actively managed profiles receive 7x more clicks than those with incomplete listings. But "complete" is only the starting point. If you're not tracking performance, you can't improve it. GBP analytics tell you:
- How many people found your listing through Search vs. Maps
- Whether searchers are looking for your business specifically (direct) or discovering you through category/keyword searches (discovery)
- Which actions users take — calling, visiting your website, requesting directions
- How your photos and posts perform relative to competitors
- Whether your review velocity is trending up or stalling out
Without this data, you're essentially running a local marketing strategy blindfolded. Our clients who come to us after years of ignoring their GBP insights are often shocked to discover they've been missing hundreds of potential customer interactions every month — not because their profile didn't exist, but because it wasn't optimized based on what the data was telling them.
The Core GBP Metrics You Should Be Monitoring Monthly
Google Business Insights (now embedded within the Google Business Profile dashboard and partially within Google Search itself) surfaces several categories of data. Here's how to read each one intelligently.
Search Queries That Triggered Your Listing
This is arguably the most underused metric in the entire GBP dashboard. Google shows you the actual search terms people used when your profile appeared. This data is invaluable for two reasons: it tells you what's already working, and it reveals keyword opportunities you're missing. If you're a plumber in Dallas and your top queries include "emergency plumber near me" but not "water heater replacement Dallas," that's a gap worth filling — either by optimizing your services section or by publishing targeted GBP posts. Our team reviews query data for every client during monthly optimization cycles and uses it to update service descriptions, categories, and post content accordingly.
Profile Views and Impressions
Views tell you how many times your Business Profile appeared in Google Search or Maps. A healthy local business should see consistent or growing impressions month over month. A sudden drop in views is a red flag — it often signals a category issue, a guideline violation, or a competitor outranking you. We track view trends across all our managed accounts and investigate any month-over-month decline of more than 15% immediately. Learn more about what might cause your profile to lose visibility in our article on why your Google Business Profile is losing customers in 2026.
Customer Actions: The Metrics Closest to Revenue
This is where GBP analytics get genuinely exciting. Google tracks four primary customer actions:
- Website clicks — how many users clicked through to your site
- Direction requests — how many users asked Google Maps to route them to you
- Phone calls — how many users tapped your phone number (mobile only)
- Message clicks — how many users initiated a chat (if messaging is enabled)
These four numbers are your conversion metrics. They tell you whether your profile is actually driving business behavior or just accumulating passive impressions. A profile with 10,000 monthly views but only 20 website clicks suggests a serious conversion problem — likely caused by weak photos, a low review rating, or missing service information. Our Google Business Profile optimization services are specifically designed to improve these action rates by fixing the profile elements that drive (or kill) customer decisions.
 Photo Views and Quantity Benchmarks
Profiles with photos receive 42% more direction requests and 35% more website clicks than those without, according to Google's own research. The photo metrics inside GBP Insights show you how many times your photos have been viewed and how that compares to businesses in your category. If competitors have significantly more photo views, it usually means they have more photos, higher-quality images, or both. We recommend a minimum of 20 photos for most local businesses, with regular additions (at least 2-4 new photos per month) to signal ongoing activity to Google's algorithm.
How GMB Guru Tracks GBP Performance for Our Clients
Raw data inside the GBP dashboard is useful, but it has significant limitations — the native interface only shows the last 6 months of data, offers no competitor benchmarking, and provides no automated alerts when performance drops. This is why our team at GMB Guru uses a layered analytics approach that goes well beyond what the standard dashboard shows.
Our Monthly GBP Analytics Process
Every client on our managed optimization plans receives a monthly performance review that includes:
- Impression trend analysis — comparing views month-over-month and year-over-year to identify seasonal patterns vs. genuine ranking shifts
- Action rate calculation — we calculate what percentage of impressions convert to calls, clicks, and direction requests, then benchmark against industry averages
- Keyword query review — identifying new search terms to target and declining terms that may indicate competitive pressure
- Review velocity tracking — monitoring the pace of new reviews, average star rating trends, and response rate compliance
- Photo engagement audit — comparing photo view counts against category competitors and scheduling new uploads accordingly
- Post performance review — analyzing which GBP post formats and topics drove the most engagement, then refining the content calendar
This isn't a set-it-and-forget-it audit. It's an active, ongoing management cycle that compounds over time. Clients who work with us for 6+ months consistently see direction requests and website click rates improve by 30-80% compared to their baseline — because we're using the data to make real decisions every single month. You can explore the full scope of what this looks like in our Google My Business optimization service.
Layering GBP Data with Google Search Console
One limitation of native GBP analytics is that it doesn't tell you what happens after someone clicks to your website. For that, you need Google Search Console and Google Analytics working together. By cross-referencing GBP click data with Search Console's local query data, you can identify whether the traffic from your GBP is converting on your website or bouncing immediately. If it's bouncing, the issue may not be your GBP at all — it may be your website's mobile experience, load speed, or landing page content. Our team helps clients make this connection and ensures that GBP optimization is coordinated with broader local SEO services for maximum impact. For an authoritative overview of how Google measures local business performance signals, refer to Google's official Business Profile performance metrics documentation.
Review Metrics: The Social Proof Layer of GBP Analytics
Review data is one of the most powerful — and most misread — components of GBP analytics. It's not just about your star rating. The metrics that matter include:
- Average star rating — anything below 4.2 is a conversion killer for most categories
- Total review count — volume matters because it signals trust at scale
- Review recency — a business with 200 reviews but none in the last 3 months looks stagnant to Google and to customers
- Response rate and response time — Google has confirmed that responding to reviews is a ranking signal
- Review sentiment — recurring keywords in reviews (positive and negative) tell you what your market actually values
Our team monitors all of these for managed clients and implements proactive review generation strategies — ethical, Google-compliant approaches that increase review velocity without violating any guidelines. For tactical guidance on this, see our full post on how to respond to Google reviews and build a review management system that works.
What "Good" GBP Performance Actually Looks Like
One of the most common questions we hear from new clients is: "Are these numbers good?" The honest answer is that benchmarks vary significantly by industry, city size, and competition level. That said, here are rough performance benchmarks our team uses as starting reference points for established local businesses in mid-size US markets:
- Monthly impressions: 1,000–5,000+ (varies heavily by category and city)
- Website click rate: 3–8% of total impressions
- Direction request rate: 1–4% of total impressions
- Phone call rate: 1–3% of total impressions
- Review response rate: 100% (every review, positive or negative, deserves a response)
- Photo views vs. category average: at or above competitor median
If your numbers fall significantly below these ranges, it's a signal that your profile needs structural optimization — not just minor tweaks. Our Google Business Profile audit checklist is a great starting point for identifying where the gaps are before you begin an optimization push.
 Common GBP Tracking Mistakes That Distort Your Data
Even when business owners do look at their GBP insights, they often misread the data in ways that lead to poor decisions. Here are the most common mistakes we see:
- Confusing impressions with reach — one user can generate multiple impressions; raw view counts can be misleading without looking at trends
- Ignoring mobile vs. desktop splits — the majority of GBP interactions happen on mobile; a bad mobile experience on your website can tank your conversion rate even with strong profile performance
- Treating all traffic sources the same — "branded" searches (people searching your business name directly) and "discovery" searches (people finding you via category/keyword) require completely different optimization strategies
- Snapshot thinking vs. trend thinking — a single month's data is nearly meaningless; performance only makes sense in the context of 3-6 month trend lines
- Not accounting for seasonal variation — a roofing company will naturally see fewer direction requests in January; always compare year-over-year, not just month-over-month
Your Monthly GBP Performance Tracking Checklist
If you're managing your own profile, here's a practical framework to check every 30 days:
- ✅ Log into your GBP dashboard and pull the last 28 days of performance data
- ✅ Record impressions, website clicks, calls, and direction requests in a simple spreadsheet
- ✅ Compare to the previous month AND the same month last year
- ✅ Review top search queries — are there new terms you should be targeting?
- ✅ Check your photo view count vs. competitor average
- ✅ Audit review count, average rating, and response rate
- ✅ Review which GBP posts performed best and plan next month's content accordingly
- ✅ Identify any significant drops and investigate their cause before the next cycle
This process takes about 30-45 minutes per month if you have a good tracking template. Our clients don't need to do any of this manually — we handle the full analytics cycle and deliver a plain-English summary of what the data means and what we're doing about it.
Ready to Stop Guessing and Start Growing?
Tracking GBP analytics isn't complicated once you know what to look for — but it does require consistency, the right tools, and the expertise to act on what the data tells you. Most business owners have enough on their plate without adding a monthly analytics cycle to the list. That's exactly why GMB Guru exists. We're a certified Google Business Profile agency that manages profiles, tracks performance, and implements data-driven optimizations for US businesses who want more calls, more direction requests, and more customers — without spending hours inside a dashboard trying to figure out what the numbers mean.
Whether your profile is underperforming, you've never looked at your insights before, or you want a professional team managing and growing your GBP presence every month, we're ready to help. Explore our Google Business Profile optimization services or get in touch with our support team to talk through what your profile specifically needs. The data is already waiting — let's use it.